The dashboard
The dashboard is where you open and configure proxy ports, manage identities and gateways, and run batch jobs. This tour walks through every tab and dialog.
Signing in
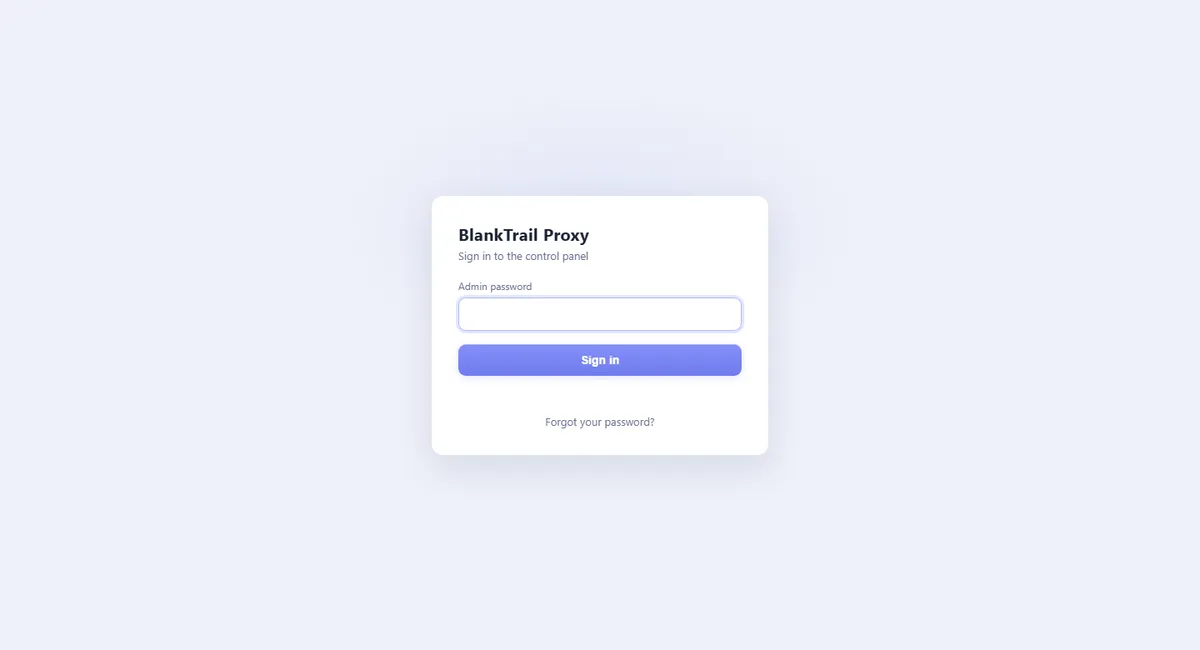
Open http://127.0.0.1:8891. If a password is set, you'll sign in first. You can switch the interface language (English, Russian, Chinese) from the header at any time.
Overview tab
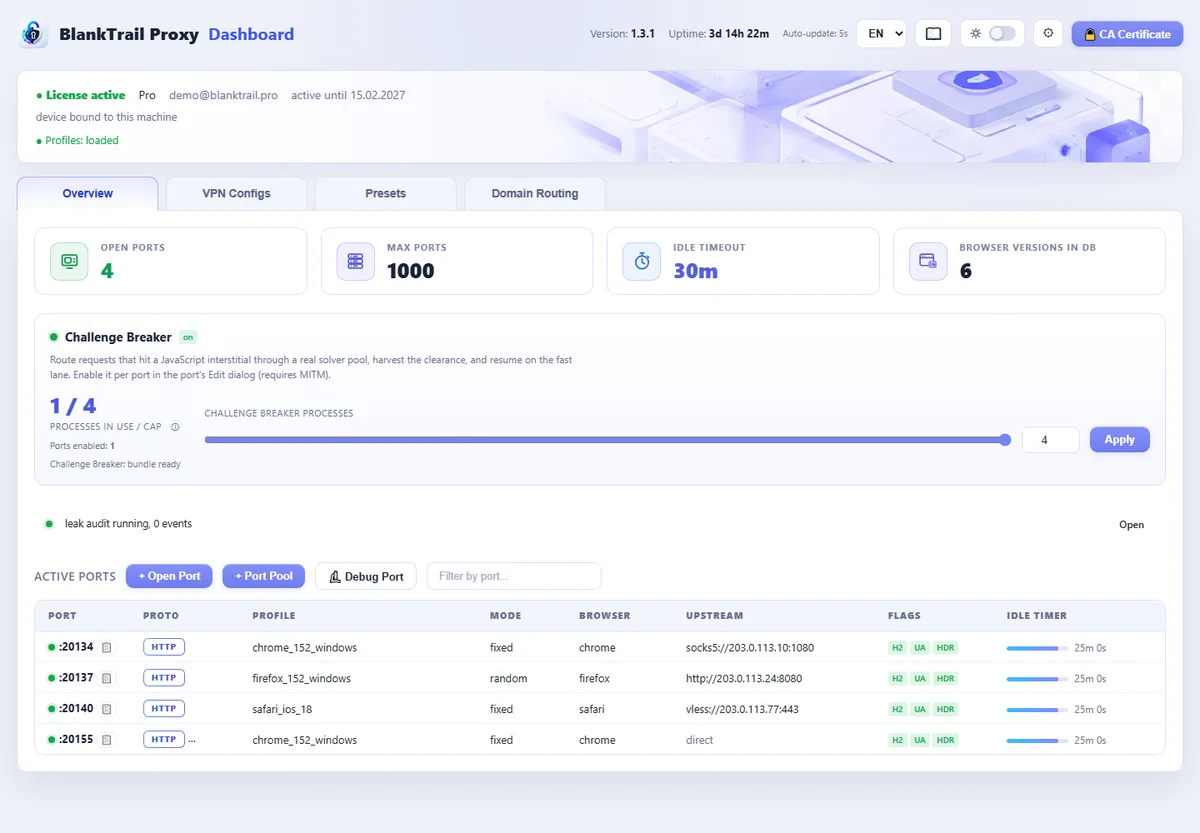
The Overview tab is the dashboard's main page. The cards at the top show the open ports, your port limit, the shared idle timeout and the number of browser versions in the profile database. Below them are the Challenge Breaker card with the solver processes in use, the leak-check line and the table of every open port.
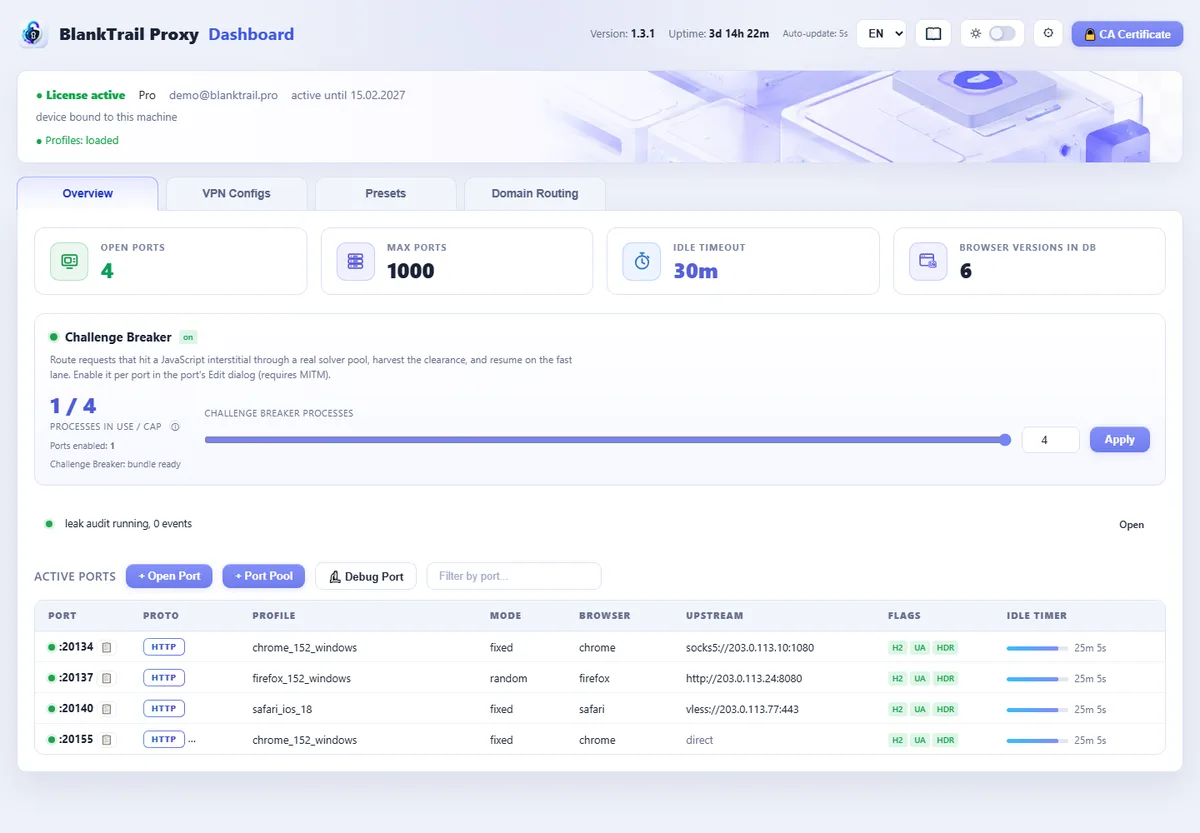
Each row shows the port number (with a one-click copy button for the proxy address), protocol, current identity, mode, browser filter, upstream and active feature flags. Click a row to expand it and edit that port's settings — identity mode, browser and OS, upstream and chain, header/HTTP-2 spoofing, and the idle timeout — or to rotate the identity, run a test, view the profile, or close the port.
- + Open Port — opens a single new proxy port.
- + Port Pool — opens a batch of ports at once.
- 🔬 Debug port — opens a port that also keeps a capture of every handshake.
- The search box filters the table by port number; a page-size selector appears when you have many ports.
The Challenge Breaker card
The card does more than show — the size of the solver pool is set from it. The “Challenge Breaker processes” slider with its “Apply” button sets how many browser processes the solver may hold at once; the value applies with no restart and survives one.
- The ceiling comes from the license. Asking for more is refused with a 409 — not a fault but the plan's limit; the ceiling itself is visible as js_solver_max_procs in the response of GET /api/v1/license/status.
- Shrinking the pool makes sense: every solver process takes memory and CPU, and on a weak machine a smaller pool runs more evenly than a large one.
- If no value is set the license cap applies — allocating processes by hand is not required.
- Next to it is the solver queue: how many tasks wait and how many are being solved right now. It is the only place where you can see tasks PILING UP rather than being solved.
Opening a port
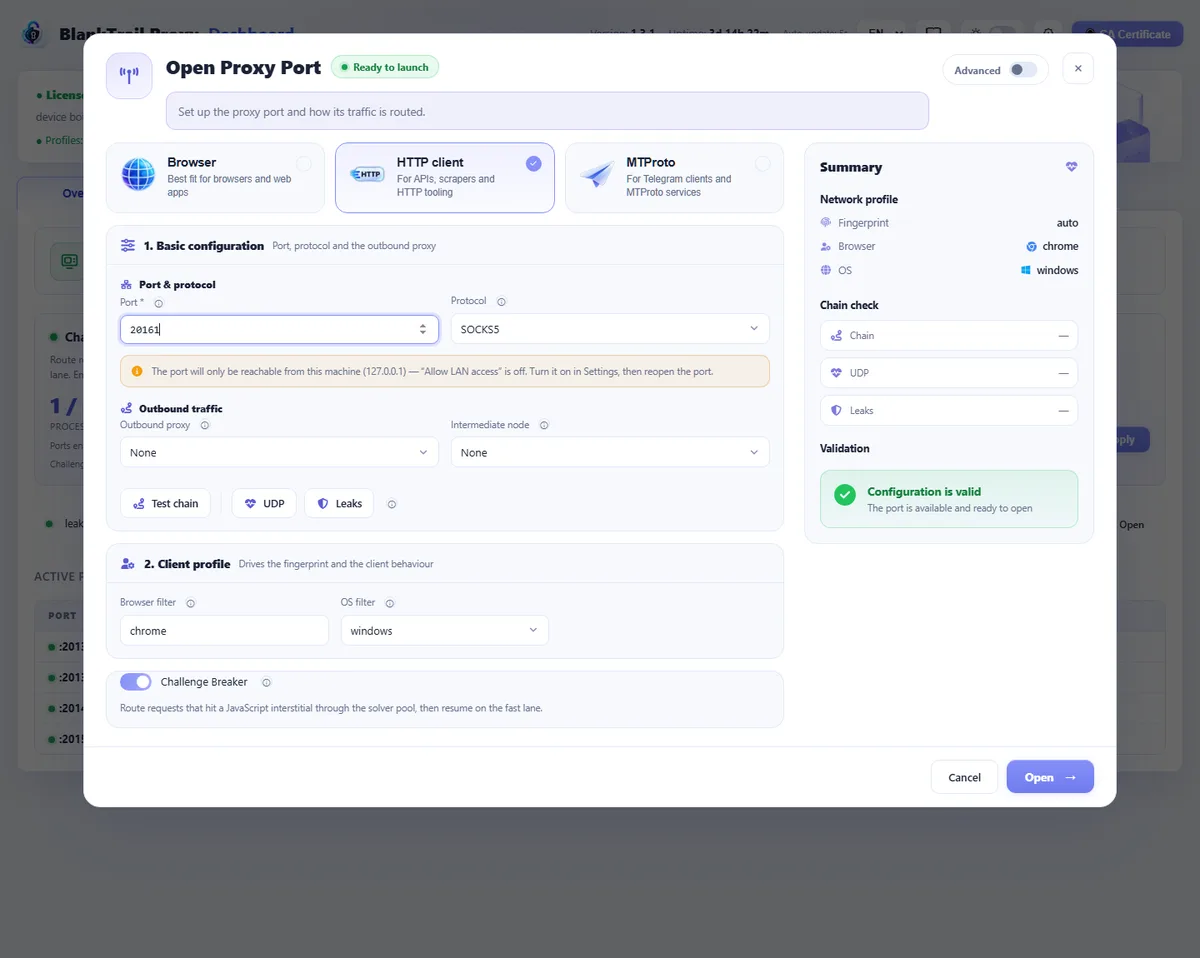
The open-port dialog starts with three quick presets, so you can get going in one click:
- Browser — for driving a real browser through the port. It matches and normalizes the browser's own fingerprint.
- HTTP client — for scripts and HTTP libraries. It assigns and presents a complete, coherent browser identity.
- MTProto — for Telegram clients and services that speak MTProto.
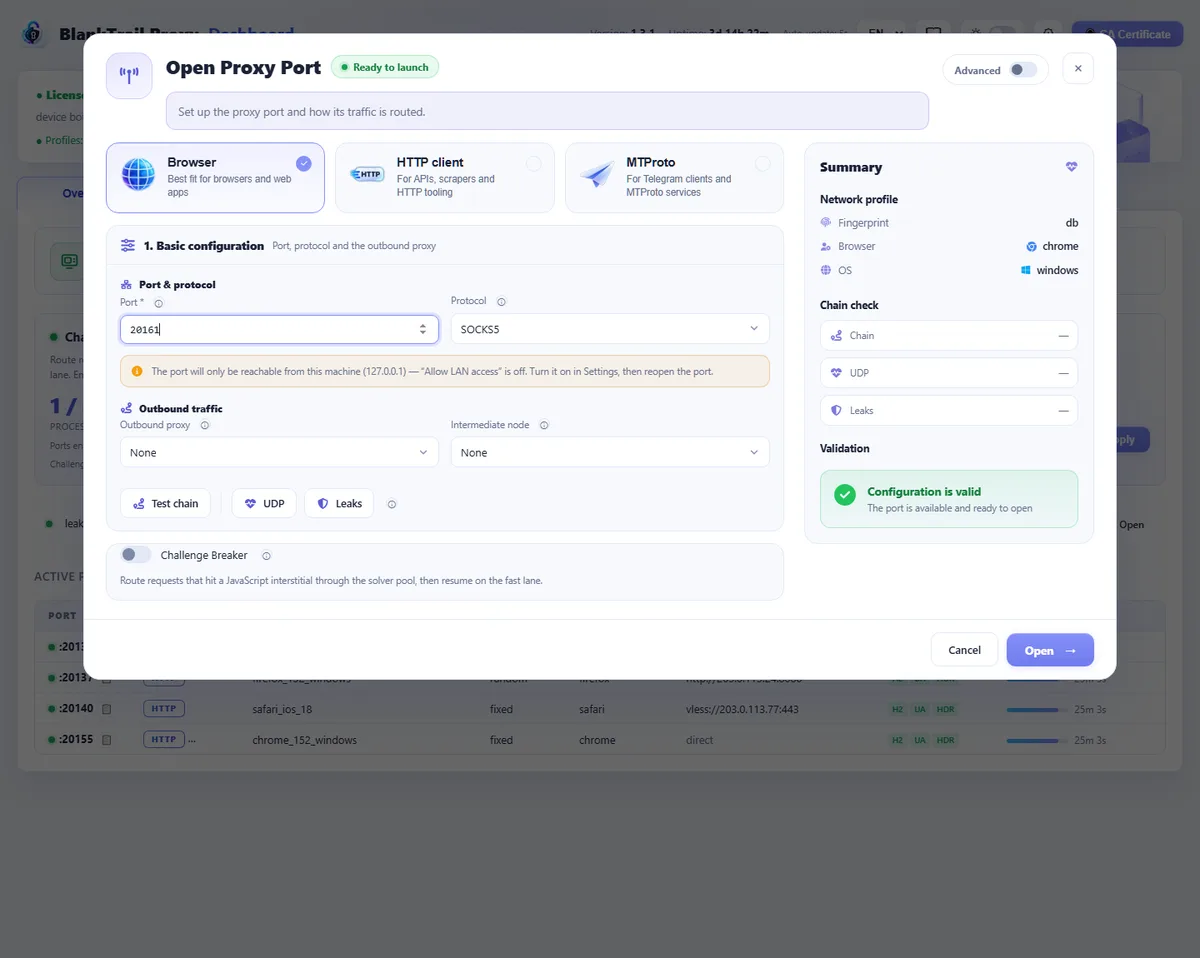
A free port is suggested automatically — from the 20000–29999 range. You can pick the protocol (SOCKS5, HTTP or MTProto), set an upstream proxy or a saved gateway, add a first hop and choose how the identity is picked. The pre-flight checks let you test the upstream and detect DNS/IPv6 leaks before the port is opened.
The dialog opens in its simple form: the preset has already filled in the rest. The “Advanced” toggle in the dialog header reveals every setting — how the identity is picked (auto, db, random, specific and custom, that is importing a real browser's fingerprint), the “Network & transport” (VDNS, custom resolvers, HTTP/3, Force IPv4) and “Advanced” (caching, traffic log, concurrency, timeouts, leak protection, tunnel behaviour) sections, the interception scope, and the MTProto fields — camouflage domain, secret, egress mode and the tg:// link with its QR code once the port is open. The choice is remembered and applies to the port-pool dialog as well.
The debug port
The debug port answers the question “what does my connection look like from the outside”. It works like an ordinary one but also keeps a capture of every handshake: TLS, ALPN, the order of extensions, the HTTP/2 settings. Open it with the Debug port button on the Overview tab.
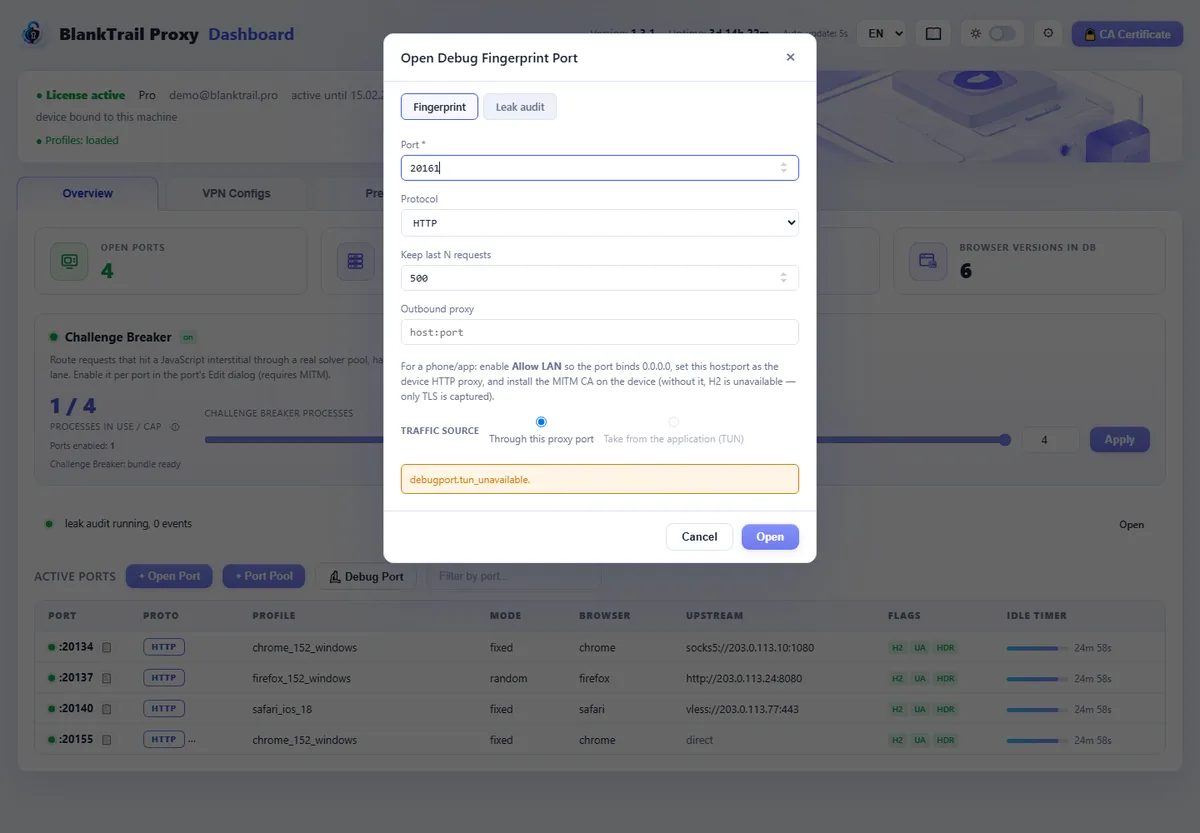
- Open a debug port and point the application at it as an ordinary proxy.
- Make a single request — the capture appears in the port's counter.
- Open the captures and compare the fingerprint with the one you expect from the chosen profile.
An application that cannot do a proxy
The debug port has two traffic sources. “Through this proxy port” — the application is pointed at it as an ordinary proxy. “Take from the application (TUN)” — the chosen program's traffic is taken from the system and fed into this same port; nothing is configured inside the program. The second is the answer to the most frequent question: “my program cannot do a proxy — how do I see its fingerprint”.
- The scope here is always the chosen application: the fingerprint is taken FROM A PROGRAM, and the debug port has no “whole system” option at all.
- QUIC is captured too: its ClientHello is read from the opening packets while the datagrams go their own way, so the application keeps working. In the feed such a fingerprint carries the quic status.
- The TUN source relies on the same privileged service as ordinary interception: without it the option is greyed out and the form says so outright.
- The capture ring size is set at open time with debug_capture_n, 500 by default; an overflow evicts the oldest.
VPN Configs tab
The VPN Configs tab manages saved gateways: OpenVPN files (.ovpn) and subscriptions that supply VLESS, VMess, Trojan, Shadowsocks, Hysteria2 and WireGuard exits. Add a gateway here once, then pick it by name when opening ports or building routes. Plain SOCKS5 and HTTP proxies never become gateways: they are set on a port via upstream (or chain_proxy), and SOCKS and HTTP nodes in a subscription are skipped as unsupported.
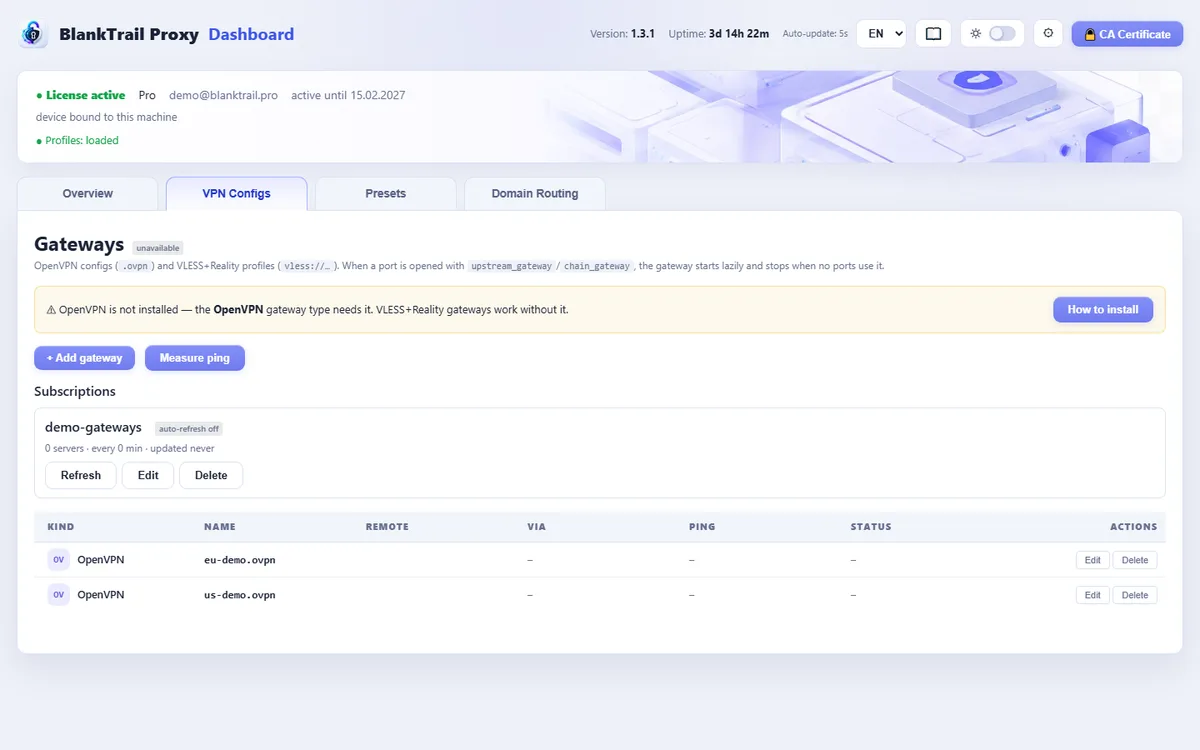
A gateway can be added in three ways, and the first is the quickest: paste ONE LINK. vless://, trojan://, ss://, vmess:// and hysteria2:// are understood. The second way is an OpenVPN or WireGuard configuration file, the third is a subscription that brings many servers at once.
- A subscription refreshes on a schedule, and the interval is set right there; the refresh button next to it re-reads it at once, without waiting.
- Every gateway has a latency check showing how many milliseconds the response takes — worth pressing before hanging a working port on that gateway.
- A gateway can be routed THROUGH another gateway (the via field): that is how a chain of two tunnels is built.
- A gateway assigned to a live port cannot be deleted — free the port first. A gateway another one goes out through is protected the same way.
Presets tab
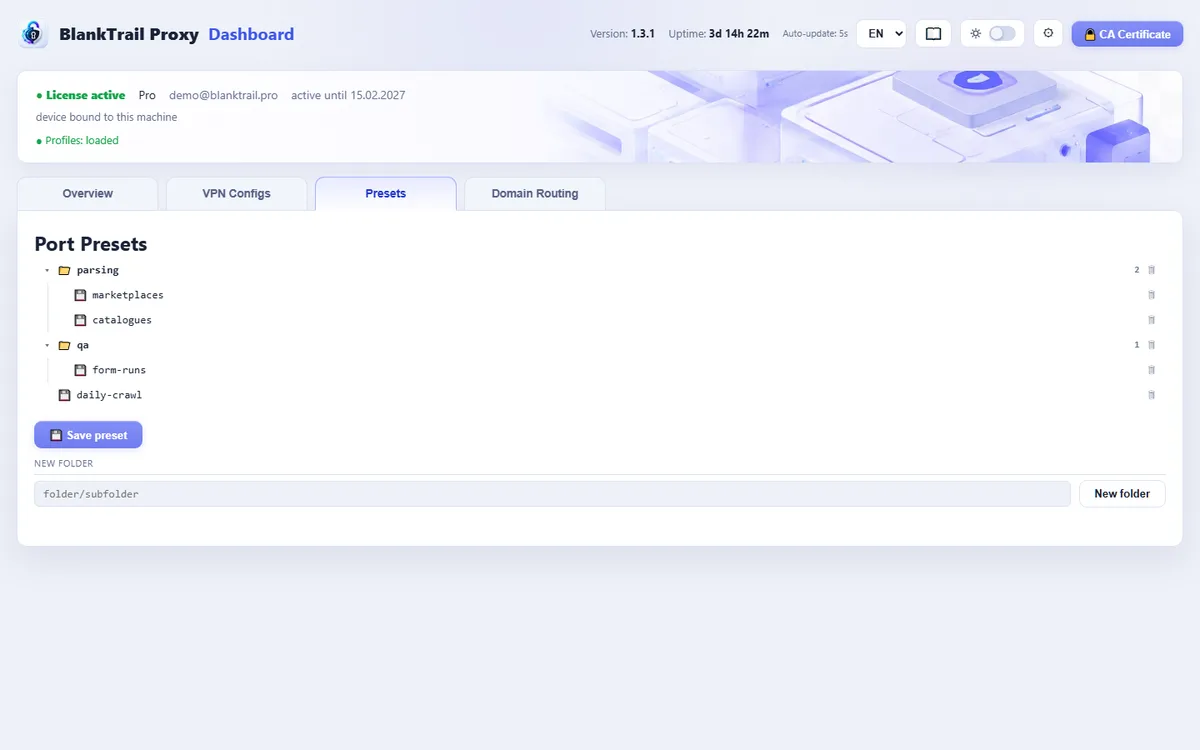
Presets let you save port configurations and re-apply them later. Organize them into folders with drag-and-drop, save all open ports or a selection, and load a preset onto a port when you need it.
Domain Routing tab
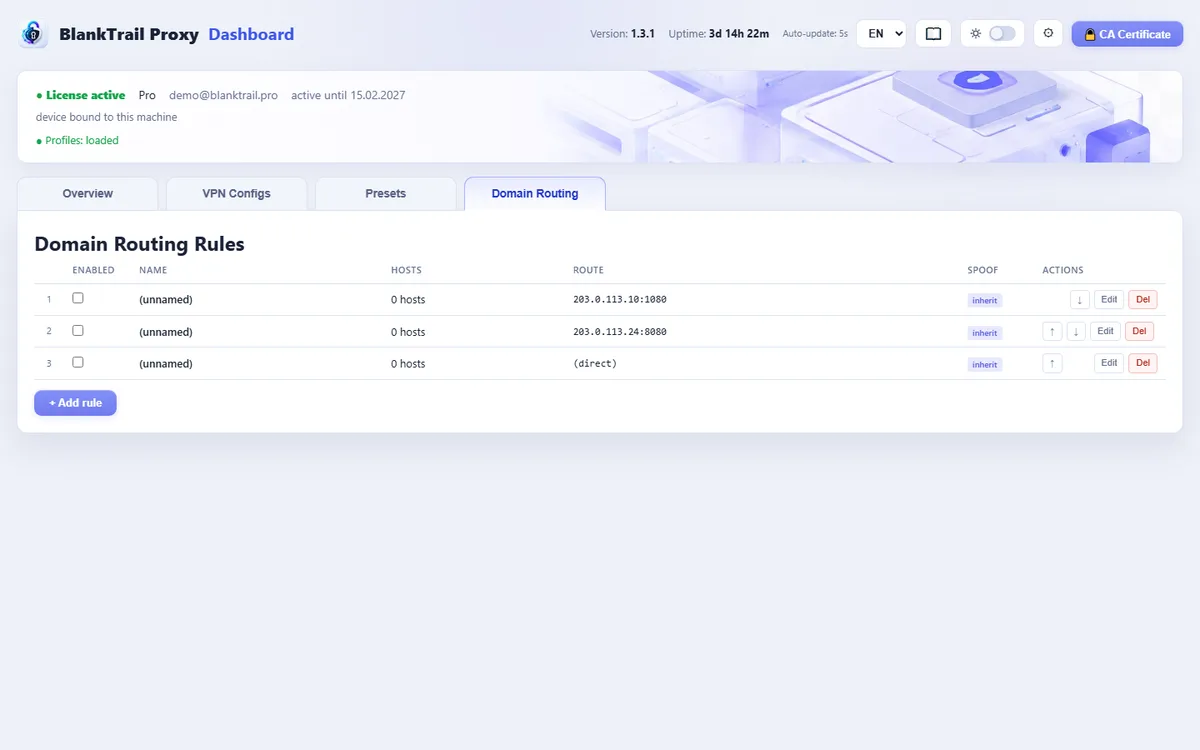
Domain routing rules send specific domains through a different upstream or gateway, or apply different settings for them. Each rule has a name, a list of domain matchers, a route, and an optional spoofing override. Rules are applied in order and saved automatically.
Port Pool
The Port Pool (the + Port Pool button on the Overview tab) opens a pool of ports from a proxy list for large, concurrent jobs. Provide a proxy list (upload a snapshot or point to a file), choose a device mix and other options, and open the pool. Running pools appear on the Overview tab, where you can watch progress and stop them.
It is a convenient fit for scrapers, parsers, posters and similar automation systems: it gives each of them a real browser's network-request identity, with no code changes and no deep integration into your application — you simply point the tool at a pooled port.
System traffic interception and the leak check
Not every application can go through a proxy: some have no settings at all, others claim support but still send part of their traffic around it. Interception solves the first, the leak check shows the second.
Interception is switched on for a port, and the application needs no configuration: the profile applies to it just as it does to those that go through the proxy themselves.
- System-wide interception lives on ONE port only: a second such port cannot be opened while the first is alive.
- The scope is set when the port is opened and does not change on a live port — close it and open it again.
- An application that pins the server certificate will break on an intercepted port: it sees our certificate instead of the expected one.
- An application already pointed at the proxy by hand is not taken by interception: it goes to the port address anyway.
The leak check watches the chosen programs and records everything they send around their port. That traffic is a leak by definition: the profile does not apply to it. Observe — the traffic passes and the events are recorded; block — what goes around is cut off.
- System traffic interceptionWhat the service does to the machine, when it is installed, how the scopes differ and what its states mean.
Name resolution and leak protection
The leak check shows the trouble; these settings close it. The main one is virtual DNS: the name lookup goes THROUGH the same tunnel as the traffic itself, so the target name never reaches your network's DNS and the provider does not see where you are going.
| Setting | Default | What it does |
|---|---|---|
vdns_mode | off | off resolves names the ordinary way; on_leak turns virtual DNS on when the pre-start check found a leak; forced always. Virtual DNS is part of the Standard plan and above: on Lite the port opens with it off. |
resolver_strategy | auto | auto picks the resolvers itself; custom takes them from the custom_resolvers list. |
custom_resolvers | — | Your own resolver list as host:port for the custom strategy. |
ecs_enabled | true | Pass the EGRESS subnet in the DNS query. Without it a CDN answers for the wrong region, and the site sees the address and the answer disagree. |
vdns_strict_bypass | false | Strict bypass: only an IP address goes out, and the hostname never leaves the machine under any circumstances. If resolution fails the connection does not happen. |
leak_guard | — | The pre-start DNS/IPv6 leak check: off, warn (open the port but warn) or enforce (do not open the port if it leaks). |
egress_force_ipv4 | true | Egress over IPv4 only. On by default: IPv6 is the most common way to leak around a tunnel. |
block_private_targets | true | Refuse connections to private, loopback, link-local and CGNAT literals. On by default — otherwise the proxy becomes a map of your local network for whoever uses it. |
require_udp_dns | false | Do not open the port at all unless the egress has proved it can carry UDP. Requires vdns_mode on_leak or forced. Without UDP neither virtual DNS nor HTTP/3 works. |
All nine settings are given when a port is opened (POST /api/v1/ports/open) and changed on a live port with PUT /api/v1/port/{port}/config — none of them has an endpoint of its own.
The response cache
The cache matters where traffic is paid for by the gigabyte: an image or a script downloaded again costs money every time. It is enabled per port, and it has four modes — not two.
| Mode | What goes into the cache |
|---|---|
normal | The ordinary cache: it lives while the application runs, honours response headers and revalidates stale entries. |
hard | The hard cache: it survives a restart and revalidates nothing. Volatile responses are therefore not admitted at all. |
hard-media | The hard cache for images, fonts, audio and video only. |
hard-autowarm | The hard cache that learns: an address is admitted once three consecutive responses came back identical — the content has proved itself static. |
Caching in spite of a no-cache header (cache_ignore_no_cache) is a separate setting, as is the exclusion list — the domains the cache steers clear of. How much the cache has already saved is visible as saved_bytes in the response of GET /api/v1/port/{port}/cache.
Logs: where to look
There are two logs and they answer different questions. The application log answers “what happened to the product”, the port's request log answers “what exactly went out on the wire”.
The application log
It sits next to the application, in data/proxy.log, and rotates by size — the old part moves to proxy.log.1. The level changes on the fly: PUT /api/v1/log_level with the body {"level":"debug"} while investigating, and back to info afterwards. On Linux the same output is visible through journalctl.
The port's request log
It is switched on by the “Traffic log” toggle in the open-port dialog — in the “Advanced” section, which appears once the “Advanced” toggle in the header is on — or by PUT /api/v1/port/{port}/traffic_log. It writes one JSON line per request — time, method, host, path, status code, body size and the cache verdict (hit, miss, excluded) — into data/traffic_port_<port>.jsonl. It is downloaded with /traffic_log/download and emptied with DELETE.
Settings
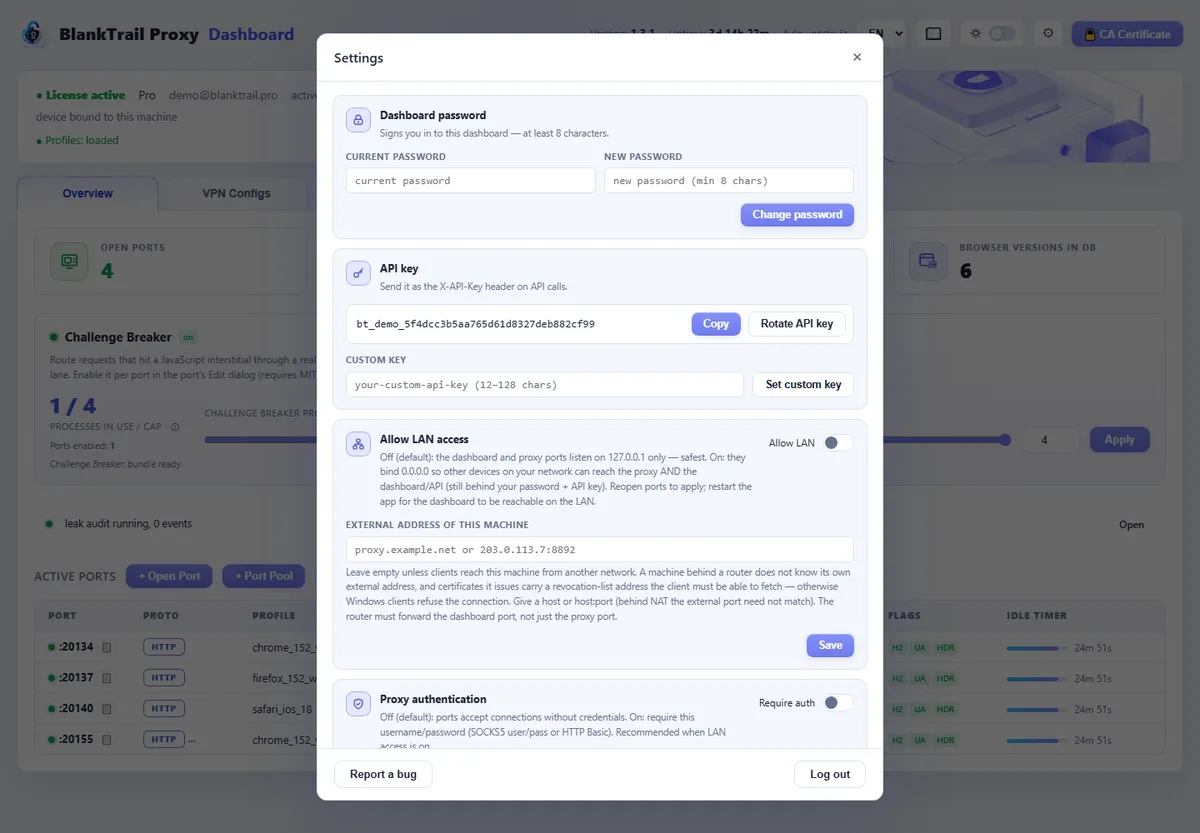
The settings dialog (the gear in the header) gathers everything about the application itself: the dashboard password, the API key for programmatic calls, access to the panel from the local network, this machine's external address, and whether the proxy ports require authorization. The external address is only needed when clients reach this machine from ANOTHER network: it goes into the revocation-list address carried by every certificate the proxy issues. The client must be able to fetch that list, otherwise Windows refuses the connection. Give a host or host:port (behind NAT the external port need not match the internal one), and the router must forward the DASHBOARD port — that is where /crl lives — not just the proxy port. It does not change the addresses at which the proxy itself is reached: those are built from the host the panel is open at plus the port number. The setting is called crl_public_host, and the address it holds lives in every issued certificate for a year. Leave it empty if the proxy is only used from this machine or from the local network.
Root certificate
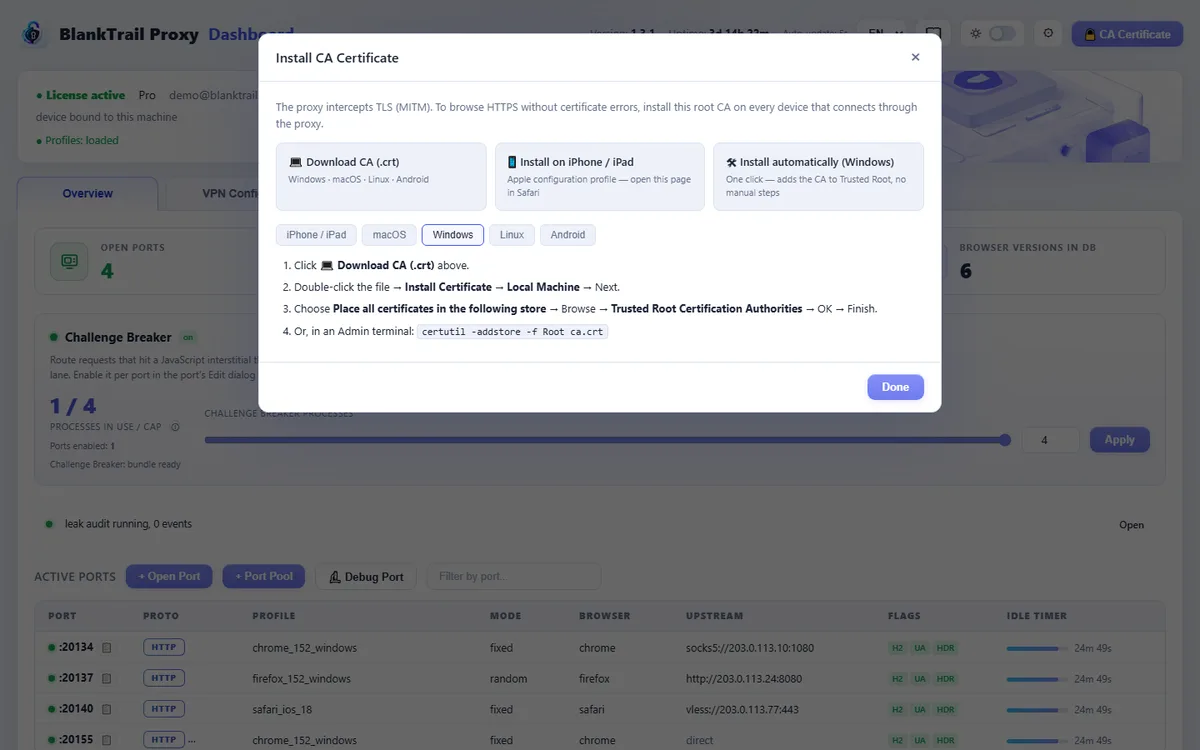
The CA Certificate button in the header opens step-by-step instructions for trusting the root certificate on each platform, plus direct downloads. Install it on every device that connects through the proxy so HTTPS works without warnings.